
Friday, December 26, 2014
Thursday, December 25, 2014
Speak - a simple Android app using Text-to-speech
Just published a simple Android app on Google Play store called Speak. The idea is pretty simple. It will speak the text typed into a text area:


It highlights the sentence being spoken.
You can also select text in any other application and use the share action to speak the selection:
While speaking it shows a notification. You can stop the speaking by tapping on the notification.
It is free. Give it a try and let me know what you think.
Friday, December 12, 2014
Chrome Developer Tools Enhancement - highlight on change
Recently I submitted a patch for Chrome Developer Tools to add the support for "Highlight on change" feature to the Scope Variables and Watch Expressions sidebar panes. Here is the feature in in screenshots:


The idea is that it highlights the properties whose values change or when the property itself comes into existence (in which case the property name is highlighted). You say you don't want to wait and want to give it a try right now! No fear...you can use my Devtools App to try this out.

Just install the Devtools App from Web Store into your Chrome browser and follow the instructions on the blog tab or read the blog entry directly.
Make sure to use this URL (in the text box after /# in Devtoola App UI above) to point to the devtools which implement the above feature:
http://chrome-developer-tools.googlecode.com/git/devtools-frontend/Source/devtools/front_end/inspector.html
Feedback welcome.
Sunday, September 07, 2014

Saturday, July 26, 2014
UPDATE: DevToolsApp now works with Chrome 36.0
DevToolsApp allows you to try different versions of Chrome Dev Tools including the latest from Chrome repository.
UPDATE: See
In this blog entry I talked about the DevToolsApp (available on Chrome Web Store).Now it works with the Chrome 36.x - your standard desktop browser. No need to download Chrome Canary.
To use it:
- Install DevToolsApp
- Download latest Chrome 36.x
- Launch Chrome with command line:
> chrome --remote-debugging-port=9222 --no-first-run
- Navigate to a page you want to debug
- Launch the DevToolsApp, select the version of the DevTools you want to debug with from the drop down and then run it by clicking on Run button next to the drop down.
- You will be shown the grid of pages available for debugging. Select the one you want to debug.

Enjoy!
Saturday, May 17, 2014
UPDATE: Chome Devtools Network Panel export and import
In this blog entry I talked about an idea about exporting and importing raw network data from Chrome Devtools Network Panel. I have made quite a bit of progress implementing the idea. I am now able to export and import the raw data. I am also able to clone the Network Panel. The only bit that remains is to convert the raw data into network requests and load them into the cloned Network Panel.

I have filed the issue.
You can try out the implementation using my DevToolsApp (download from Chrome Web Store). Use the following URL for export/import raw network data capable Chrome Devtools:
https://sandipchitaleschromedevtoolsrnd.googlecode.com/git/Source/devtools/front_end/inspector.html
I have added this URL to the preconfigured URLs in DevToolsApp and the new (1.1) version of DevToolsApp should appear soon on the Chrome Web Store.
Feedback is welcome!
Thursday, May 08, 2014
UPDATE on Windows 8.1 Thin Taskbar
I love the feature of 7+ Taskbar Tweaker which was recently updated to enable making the Windows 8.1 Update vertical Taskbar, 1 small icon width thin. The issue with the notifications area has also been fixed making the toolbar truly thin.

However, one does not have to have the 7+ Taskbar Tweaker running all the time. So I wrote this simple c# program to start and stop 7+ Taskbar Tweaker after reboot or after changing the set of monitors the computer is connected to. The start and stop restores the thin taskbar. Of course if you are using other excellent features of 7+ Taskbar Tweaker (thank rammichaels for that) you can let it start at startup and leave it running.
using System;
using System.Diagnostics;
using System.Runtime.InteropServices;
namespace ThinTaskbar
{
static class Program
{
#region Native API
// The native API functions/enums/structs needed to access taskbar info
// consult MSDN for more detailed information about them
[DllImport("user32.dll")]
private static extern IntPtr FindWindow(string lpClassName, string lpWindowName);
// [DllImport("User32.dll")]
// private static extern bool MoveWindow(IntPtr hWnd, int x, int y, int cx, int cy, bool repaint);
#endregion
///
/// The main entry point for the application.
///
[STAThread]However, one does not have to have the 7+ Taskbar Tweaker running all the time. So I wrote this simple c# program to start and stop 7+ Taskbar Tweaker after reboot or after changing the set of monitors the computer is connected to. The start and stop restores the thin taskbar. Of course if you are using other excellent features of 7+ Taskbar Tweaker (thank rammichaels for that) you can let it start at startup and leave it running.
using System;
using System.Diagnostics;
using System.Runtime.InteropServices;
namespace ThinTaskbar
{
static class Program
{
#region Native API
// The native API functions/enums/structs needed to access taskbar info
// consult MSDN for more detailed information about them
[DllImport("user32.dll")]
private static extern IntPtr FindWindow(string lpClassName, string lpWindowName);
// [DllImport("User32.dll")]
// private static extern bool MoveWindow(IntPtr hWnd, int x, int y, int cx, int cy, bool repaint);
#endregion
///
/// The main entry point for the application.
///
static int Main()
{
// Start and stop "7+tt"
ProcessStartInfo startInfo = new ProcessStartInfo();
startInfo.FileName = "C:\\Users\\sandip\\AppData\\Roaming\\7+ Taskbar Tweaker\\7+ Taskbar Tweaker.exe";
startInfo.WindowStyle = ProcessWindowStyle.Hidden;
Process sevenplustt = Process.Start(startInfo);
System.Threading.Thread.Sleep(500);
sevenplustt.CloseMainWindow();
sevenplustt.WaitForInputIdle();
sevenplustt.Kill();
return 0;
}
}
}
IMO, thin vertical taskbar should be standard feature (make it an option) of windows desktop when used in traditional way - keyboard + mouse. I understand why the Taskbar needs to be little thicker for touch interface to work correctly, but it is not as if everyone has switched to touch interfaces. Also why can't this be an option, possibly even turned off by default Microsoft wants to discourage it. I do not like it when they know better that the users. This reminds me of debate on Mac OS as to why the windows cannot be resized from all side, which the Apple and their fanboys ridiculed for long time and now Mac OS supports it. Go figure!
Eclipse: Show All Instances of Java Type Eclipse Plugin works for Groovy classes
In this blog entry I talked about the Show All Instances of Java Type Eclipse Plugin. Not surprisingly it also works while doing Groovy/Grails debugging also.


Install the plugin from Eclipse Marketplace website or Eclipse Marketplace Client.

Enjoy!
Install the plugin from Eclipse Marketplace website or Eclipse Marketplace Client.
Enjoy!
FireJSOD available on Mozilla Add-ons site
Available on Mozilla site: https://addons.mozilla.org/
Tuesday, May 06, 2014
Idea: Chome Devtools Network Panel export and import
Sure Chrome Devtools Network Panel has the Save All as HAR with Content menu :


but that saves the network traffic in HAR format - which is a standard format but does not capture the network traffic as one sees it when it is live. Also when viewed in HAR viewers the requests get grouped by pages, instead of the exact order in which the requests were issued. This especially is sub-optimal when tracking multi-page redirects - especially when the Preserve Log is checked.
To me that is not satisfactory. Instead why not export the raw data from Network Panel and when imported load it in a separate Network Panel. That way you can exactly see the way it was recorded initially. Granted this will be very specific to Chrome Devtools, but then who uses any other browser :) Just kidding.
Anyhow, after my experience with JSOD integration with Chrome Devtools, I feel encouraged to implement the above. The idea will be to add an Export Raw... and Import Raw... menu items to the above context menu. Export functionality will basically export the raw data behind the Network Panel. Import will create an Network Panel clone and load the data in it.I will develop the import functionality in a modular fashion so that it can be launched standalone.
I have started the work on this. The Google code git repository:
https://code.google.com/p/sandipchitaleschromedevtoolsrnd/
Current progress:
TODO:
Almost there. Stay tuned!
Unfortunately I am not able to save the raw network data to a file directly. So I cam up with this solution:
File selection dialog for selecting .rnd files:
Imported Network Panel
but that saves the network traffic in HAR format - which is a standard format but does not capture the network traffic as one sees it when it is live. Also when viewed in HAR viewers the requests get grouped by pages, instead of the exact order in which the requests were issued. This especially is sub-optimal when tracking multi-page redirects - especially when the Preserve Log is checked.
To me that is not satisfactory. Instead why not export the raw data from Network Panel and when imported load it in a separate Network Panel. That way you can exactly see the way it was recorded initially. Granted this will be very specific to Chrome Devtools, but then who uses any other browser :) Just kidding.
Anyhow, after my experience with JSOD integration with Chrome Devtools, I feel encouraged to implement the above. The idea will be to add an Export Raw... and Import Raw... menu items to the above context menu. Export functionality will basically export the raw data behind the Network Panel. Import will create an Network Panel clone and load the data in it.I will develop the import functionality in a modular fashion so that it can be launched standalone.
I have started the work on this. The Google code git repository:
https://code.google.com/p/sandipchitaleschromedevtoolsrnd/
Current progress:
- As seen above, I am now adding the Export Raw... and Import Raw... context menu items.
- Able to capture the network raw requests.
- Able to create the Imported Network Panel
- With the following code I am able to export the requests in JSON format
- Now am able to import the data back.
JSON.stringify(this._requests, function(key, value) {
if (value instanceof WebInspector.Target) {
return;
}
return value;
}, 4);
- Export
- Export the data in JSON format to a file or URL.
- Import
- Convert it into WebInspector.NetworkRequest
- Load the converted WebInspector.NetworkRequest into Imported Network Panel
Almost there. Stay tuned!
Friday, May 02, 2014
DevToolsApp
A simple Chrome Packaged App to try out different versions of Chome Devtools or your own or someone else's enhancements/fixes served from a accessible URL :

GitHub
Showcase Chrome Debugging Protocol Clients
Showcase Chrome Debugging Protocol Clients
To try this:
- Install Chrome
- Run Chrome with --remote-debugging-port=port e.g.
> ...\chrome.exe --remote-debugging-port=9222 --no-first-run
- Load page to be debugged in it
- Install DevToolsApp from Chrome Web Store.
- Launch it. You will see a window like the screenshot above.
- Click on the run button.
- Select the page to be debugged by clicking on it from the list of pages shown
- Voila, it should load the devtools and start debugging the selected page
DevToolsApp also tries to get latest 15 branch URLs from the site below:
Of course you are free to type branch number or even the whole devtools URL that you want to load.
When you click in the devtools URL input field it will show you a popup with some information (if available) about the specified devtools. Explore various devtools URLs.
http://src.chromium.org/blink/branches/chromium/Of course you are free to type branch number or even the whole devtools URL that you want to load.
When you click in the devtools URL input field it will show you a popup with some information (if available) about the specified devtools. Explore various devtools URLs.
Feedback welcome.
Thursday, April 24, 2014
POM 360
Checkout the cool implementation of automatic textarea resize in (POM360.js) after:
- Window resize
- Tab change
- Show/Hide of footer
tricks used:
- $(window).resize(fn)
- $rootScope.$on('$stateChangeSuccess', fn() {setTimeout(fn, 0)});
- track show/hide of detail footer

Implemented using:
- node webkit
- AngularJS
- UI router
- bootstrap
How to run:
- Download node-webkit
- Download POM360NW.nw
- Run it
> nw POM236NW.nw
Tuesday, April 22, 2014
Friday, April 18, 2014
GitChrome Package App will be cool!
After having used GitHub for Windows I am really inspired to implement the same as a Chrome Packaged App.

The window frame of a Chrome Package App is very similar to the one we see above. So here is what I am thinking:
GitHub for Windows
The window frame of a Chrome Package App is very similar to the one we see above. So here is what I am thinking:
- Chrome Package App implementation
- Ability to access local filesystem [1] to access local repositories
- the required look
- AngularJS+Bootstrap for the UI
- Possibly look into JavaScript implementation of Git API (not sure if this is alive) or Git.js or develop one.
Come to think of it node webkit may be a better implementation alternative! Looking into it. Seen and example of using node-webkit to develop desktop app - POM360 .
I am going to call it GNIT (Git, Node, Webkit).
Stay tuned!
Tuesday, April 15, 2014
FireJSOD 1.8 available
FireJSOD 1.8 is now available. Many bug fixes including:
The JavaScript Object Diagram menu item is now shown where ever a object is shown e.g. DOM Panel, Console expression results etc. Get it:
- disabled selection while dragging in the diagram
- fix property enumeration using Object.getOwnPropertyNames(value)
The JavaScript Object Diagram menu item is now shown where ever a object is shown e.g. DOM Panel, Console expression results etc. Get it:
Tuesday, April 08, 2014
FireJSOD: JavaScript Object Diagram integration with Firebug | Watches Tab
[UPDATE: Now listed on Firebug Extensions page]

Almost there:

See
If someone wants to try it, here is the .xpi:
FireJSOD.xpi
[Just tried it on Firefox: 31.0a1 (2014-04-14) and Firebug: 2.0b1 combo and FireJSOD seems to work also.]
TODO
and the git repository:
FireJSOD.xpi
[Just tried it on Firefox: 31.0a1 (2014-04-14) and Firebug: 2.0b1 combo and FireJSOD seems to work also.]
TODO
- A few more bug fixes
- Unified display of object labels and properties, currently it is a little hodge-podge.
- Get it listed on getfirebug.com extensions page. Filed the issue.
and the git repository:
Monday, April 07, 2014
Windows 8.1 thin vertical taskbar
[Update: The May 2nd 2014 beta release of 7+ Taskbar Tweaker has a fix for Windows 8.1 update. Yay! Also I am now using classic shell in combination with 7+ Taskbar Tweaker.]
[Update: April 20th 2014 Windows 8.1 update has temporarily broken this :( Apparently a new fix is in the works.]
I recently acquired a new laptop with Windows 8.1 on it. I like to dock my task-bar on the left edge of my screen and like it as thin as possible. There are specific reason for this choice:
- Vertical task-bar because widescreen monitors means plenty of horizontal space but relatively less vertical screen real estate
- Task-bar docked to left edge because that way the task bar does not interfere with vertical scroll-bar interaction on the right side of maximized windows - when the auto hide task-bar is turned on.
I had blogged about how to get a thin vertical task-bar on Windows 7 here. Unfortunately that does not work on Windows 8 or 8.1. The task-bar stays 2 icon wide. Bummer.

After a little bit of search I found this excellent utility - 7+ Taskbar Tweaker. This has a set of Advanced options (right-click the 7+ Taskbar Tweaker's system tray icon, select Advanced Options) to remove the minimum width limit on the vertical task-bar.
How to configure it ?
- Install 7+ Taskbar Tweaker and run it. You can close the dialog that is displayed.
- Make sure to dock the task-bar to the left edge
- Make sure that it is not locked
- Make sure that you have selected Use small icons option in the task-bar properties
- In the 7+ Taskbar Tweaker Advanced options (right-click the 7+ Taskbar Tweaker's system tray icon, select Advanced Options) just set the value of no_width_limit to 1 and click OK.
(other options have been removed from the screenshot for focus)
- Then drag the right edge of the task-bar to make it 1 icon thick
If you do not configure the 7+ Taskbar Tweaker to run at startup, after reboot the task-bar will become 2 icon thick again. Simply run the 7+ Taskbar Tweaker and the 1 icon wide task-bar will be restored. After this you may even exit the 7+ Taskbar Tweaker tray icon.
Sunday, April 06, 2014

Tuesday, April 01, 2014
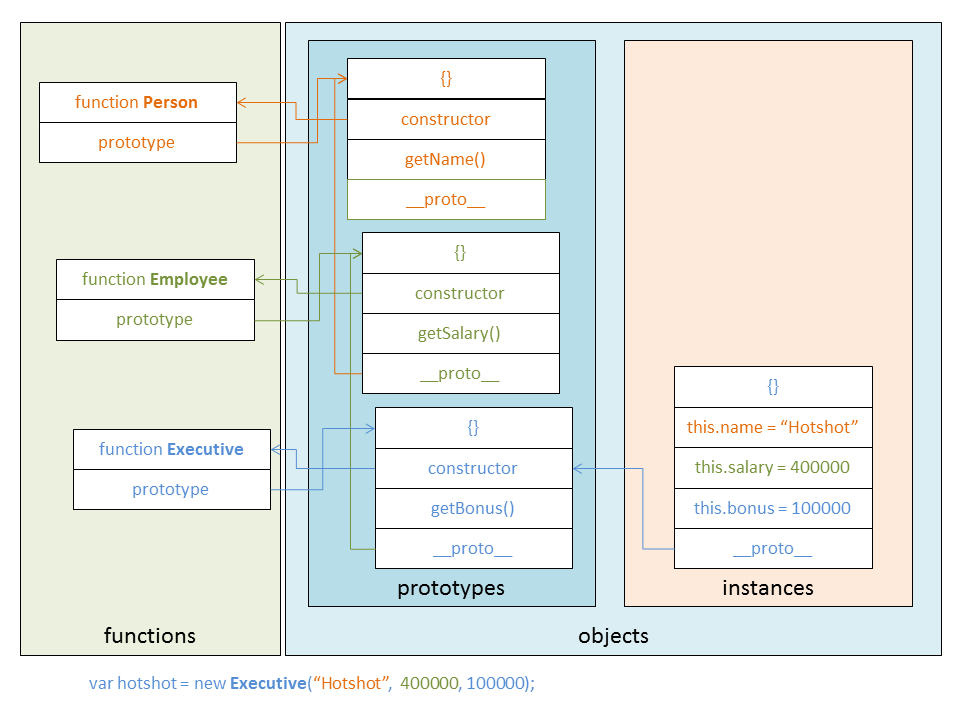
JavaScript object types for JSOD
In this blog entry I talked about integration JavaScript Object Diagam (JSOD) with Chrome Devtools. While thinking about it in terms of how to lay out the objects in JSOD I came to this realization i.e. there are three types of objects from the point of view of JSOD. These are as follows:

- Standard objects [ 1 ] - these are typically created using the new operator on a constructor function. These inherit the constructor [ 4 ] property from the prototype object of the constructor function. The standard object's __proto__ [ 7 ] hidden link refers to prototype objects.
- Prototype objects [ 2 ] - these are objects that are prototypes of functions which are internally created by new operator. These objects have their own constructor [ 5 ] property. The standard object's __proto__ [ 7 ] hidden link (typically) refers to these objects. The prototype property of the constructor functions point to these objects.
- Function object [ 3 ]- these are function objects used for creation of other object's using new operator. The prototype [ 6 ] property of function objects refer to prototype object.
I hope that JSOD becomes a standard way for diagramming JasvaScript objects.
Friday, March 28, 2014
Chrome extension syntaxit
Here is a simple Chrome Extension - syntaxit.
or


- Install it from Chrome Web Store
or
- git clone https://github.com/sandipchitale/syntaxit.git
- Install it as unpacked extension (How?)
You will see this browser action icon in the Chrome toolbar:
Visit any page that has JavaScript code in a pre tag which has not been been syntax colored yet by some other plugin. For example this page.

And then click on the syntaxit icon in the toolbar. Boom...you will see this:
And then click on the syntaxit icon in the toolbar. Boom...you will see this:
Uses Prismjs syntax coloring library.
Currently assumes JavaScript by default. Tries to guess Java using a simple keyword match.
TODO
Currently assumes JavaScript by default. Tries to guess Java using a simple keyword match.
TODO
- Implement more sophisticated language recognition
Get this extension on Chrome App storeChrome Web Store
Dev Art Submission
Available on Chrome Web Store.
It appears that there are 160 completed entries. So I have 1 in 8 chance to make it to top 20 :)

Friday, March 21, 2014
UPDATE: Overview Plugin for Eclipse
Based on requests from several users I have updated the Overview Plugin. It now allows you to set the size of the font used in the Overview view. The size is also persisted in preferences.

Get it here.
Get it here.
Thursday, March 20, 2014
JavaScript Object Diagram integration with Chrome Devtools | Sources Tab | Scope Variables section
UPDATE: You may want to check out this entry to easily try out the JSOD integration.
In this blog entry I blogged about the JavaScript Object Diagram. In it I mentioned that the JavaScript Object Diagram can be integrated with the Chrome Developer Tools | Sources Tab | Scope Variables section. So I started the implementation and I have finished the implementation.
How does it work?
When the debugee is suspended, in the Sources Tab | Scope Variables section you can see the scope variable. If you right click on a value of a variable you will see the JavaScript Object Diagram menu item in the context menu like so:

And selecting the menu shows this:

Supports:
- Now support diagramming of arbitrary expression.
- You can also click on the = button in the cells of object, array and function type properties to load then in the view
- Pan
- Using buttons
- Using mouse drag
- Using mouse wheel
- Zoom
- Using buttons
- Using Slider
- Using mouse wheel (hold Ctrl down)
- Reset
- Click on home button to pan to origin
- Click again quickly again to reset zoom to 100%
Try it
You can try it today.
Follow these instructions:
- Download and install Chrome Canary from here.
- Launch it with command:
"c:\Users\...\AppData\Local\Google\Chrome SxS\Application\chrome.exe" --remote-debugging-port=9222 --no-first-run --user-data-dir=C:\temp\devtoolsprofile
- This basically launches the debug server which can display the list of pages available for debugging.
- Then go to any page that you want to debug.
- Create another tab and go to url:
http://localhost:9222/#https://sandipchitaleschromedevtoolsstuff.googlecode.com/git/front_end/inspector.html?experiments=true
or alternatively:
UPDATE: You may want to check out this entry to easily try out the JSOD integration.
- This will show the list of pages available for debugging as mentioned 3 steps ago. Select the one you want to debug. This will load the my devtools code located at
https://sandipchitaleschromedevtoolsstuff.googlecode.com/git/front_end/inspector.html
- Now set a breakpoint. When it is hit go to Sources Tab > Scope Variables section, choose a variable you want to diagram and right click on it's value to JavaScript Object Diagram menu item and you will see the diagram (see screenshot above).
I hope this helps JavaScripts beginners understand the JavaScript's prototypical inheritance.
TODO
- Submit a patch to Chrome Developer Tools.
- Files a enhancement request Issue 357962 . Attached a patch today (3/29/2014). Please star the issue if you want to see this feature included or at least implemented side by side with devtools.
- Wait for it to be accepted (hopefully) and may be available optionally
BTW I was able to use the excellent GitHub for Windows client to work with the above Google Code git repository. No problem. Simply dragged and dropped the folder from Explorer on top of the GitHub for Windows window.

Stay tuned!
Saturday, March 15, 2014
Angular directive ng-jsod for drawing JavaScipt Object Diagram
UPDATE: I have now integrated the JSOD with Chrome devtools. Check it out! Does not use the AngularJS rective though, instead uses the Chrome devtools framework.
I have been meaning to hack this for long time. The idea is to draw a object diagram of for a JavaScript object. Finally got around to implementing it as a angular directive. It uses excellent jquery-svg library by Keith Wood.
Note: Currently works on Chrome only.
Usage:
in .html head section:
:
:
<link rel="stylesheet" type="text/css" href="css/jquery.svg.css">
:
<script src="http://ajax.googleapis.com/ajax/libs/jquery/1.11.0/jquery.min.js"></script>
<script src="http://code.angularjs.org/1.2.1/angular.min.js"></script>
<script type="text/javascript" src="js/jquery.svg.js"></script>
<script src="js/ngjsod.js"></script>
<script src="js/ngjsodapp.js"></script>
:
:
in .html body section:
:
<ng-jsod object-name="document.location"></ng-jsod>
:
in your app's .js file inject NGJSOD module:
angular.module('NGJSODApp', ['NGJSOD']);
This will yield:

Try it here!
I have been meaning to hack this for long time. The idea is to draw a object diagram of for a JavaScript object. Finally got around to implementing it as a angular directive. It uses excellent jquery-svg library by Keith Wood.
Note: Currently works on Chrome only.
Usage:
in .html head section:
:
:
<link rel="stylesheet" type="text/css" href="css/jquery.svg.css">
:
<script src="http://ajax.googleapis.com/ajax/libs/jquery/1.11.0/jquery.min.js"></script>
<script src="http://code.angularjs.org/1.2.1/angular.min.js"></script>
<script type="text/javascript" src="js/jquery.svg.js"></script>
<script src="js/ngjsod.js"></script>
<script src="js/ngjsodapp.js"></script>
:
:
in .html body section:
:
<ng-jsod object-name="document.location"></ng-jsod>
:
in your app's .js file inject NGJSOD module:
angular.module('NGJSODApp', ['NGJSOD']);
This will yield:
Try it here!
Github Repository
This is an initial attempt. Obviously needs clean up.
TODO
This is an initial attempt. Obviously needs clean up.
TODO
- Cleanup. The svg code was written in a brute force fashion. Modularize it,
- Better layout, support scrolling,
panning, zooming,overview for the svg. - Integrate with Chrome Devtools's Scope Variables section in the Sources tab. Right click on a object to see it's diagram. I am working on this now and will submit the patch to Chrome Dev Tools. Unfortunately the dev tools extension API does not allow to put a context menu on nodes of Scope Variables nodes. If it allowed that I could have simply written a Chrome extension. The idea behind this is that it will help developers understand the JavaScript object structure.
Feedback welcome!
Thursday, March 13, 2014
Enhanced JavaScript inheritance
Even more compact than this but exactly equivalent and a little bit of mind twister....
Note that the "super" function name is specified only once in the constructor function. And if the order of parameters of "super" is consistent and it ignores the extra params the
arguments.callee.prototype.__proto__.constructor.call(this, name, salary);
in Executive can even be replaced by:
arguments.callee.prototype.__proto__.constructor.apply(this, arguments);
making it completely boiler plate.
This will allow private and read-only properties also. Can anyone show how?
Code:
function Person(name) {
this.name = name;
}
Person.prototype.getName = function() {
return this.name;
}
function Employee(name, salary) {
// One time initialization of instance methods
if (arguments.callee.prototype.__proto__ === Object.prototype) {
arguments.callee.prototype.__proto__ = Person.prototype;
arguments.callee.prototype.getSalary = function() {
return this.salary;
}
}
arguments.callee.prototype.__proto__.constructor.call(this, name);
this.salary = salary;
}
function Executive(name, salary, bonus) {
// One time initialization of instance methods
if (arguments.callee.prototype.__proto__ === Object.prototype) {
arguments.callee.prototype.__proto__ = Employee.prototype;
arguments.callee.prototype.getBonus = function() {
return this.bonus;
}
}
arguments.callee.prototype.__proto__.constructor.call(this, name, salary);
this.bonus = bonus;
}
var hotshot = new Executive('Hotshot', 400000, 100000);
var workerbee = new Employee('Workerbee', 100000);
hotshot instanceof Executive => true
hotshot instanceof Employee => true
hotshot instanceof Person => true
workerbee instanceof Executive => false
workerbee instanceof Employee => true
workerbee instanceof Person => true

It is my understanding that arguments.callee is going to be deprecated in ES6. No fear, it can simply be replaced by the CTOR function name.
Tuesday, March 11, 2014
Simple JavaScript inheritance
Code:
function Person(name) {
this.name = name;
}
Person.prototype.getName = function() {
return this.name;
}
function Employee(name, salary) {
Person.call(this, name);
this.salary = salary;
}
Employee.prototype.__proto__ = Person.prototype;
Employee.prototype.getSalary = function() {
return this.salary;
}
function Executive(name, salary, bonus) {
Employee.call(this, name, salary);
this.bonus = bonus;
}
Executive.prototype.__proto__ = Employee.prototype;
Executive.prototype.getBonus = function() {
return this.bonus;
}
var workerbee = new Employee('Workerbee', 100000);
var hotshot = new Executive('Hotshot', 400000, 100000);
hotshot instanceof Executive => true
hotshot instanceof Employee => true
hotshot instanceof Person => true
workerbee instanceof Executive => false
workerbee instanceof Employee => true
workerbee instanceof Person => true
hotshot instanceof Executive => true
hotshot instanceof Employee => true
hotshot instanceof Person => true
workerbee instanceof Executive => false
workerbee instanceof Employee => true
workerbee instanceof Person => true
Picture:

Comments?
Other than use of __proto__ (bad! I know).
Subscribe to:
Posts (Atom)